Gazetteer Indexes
Generating complex gazetteer indexes is the bane of cartographers. Before the advent of computers, this was an entirely manual process. With the development of geographic information systems and relational databases, the process has been automated somewhat, though in spite of this automation process, errors can still creep in.
Spatial Vision has produced the last three editions (7, 8 and 9) of the Jacaranda Atlas for John Wiley & Sons, and by far the biggest individual task is indexing the features that appear on the atlas maps. The task of indexing takes roughly 4 to 5 weeks of production time to generate, collate, format and check.
The purpose of the gazetteer index is to locate a feature on a map that places it in the most appropriate context. This can be challenging when the feature appears on more than one map. Additionally, the index should provide some extra information about the feature—its location in latitude and longitude and a description of the feature (park, mountain, bay, etc) (Irvine, 2005).
As has been explained earlier, Spatial Vision uses a multi-step approach to the production of the atlas maps. This blog proposes an alternative approach (one that has been tried and tested) to map production and index generation done entirely within in one production environment, namely Adobe Illustrator and MAPublisher. The indexing uses a little known (and undocumented) feature of MAPublisher to create additional data for the labels to make indexing easier.
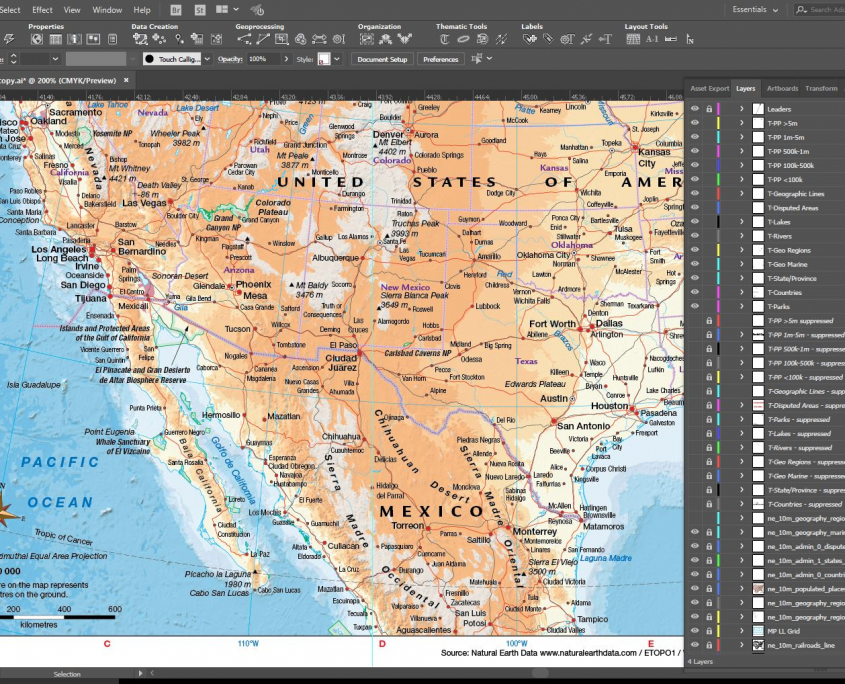
Figure 1 – Adobe Illustrator master map fileAll good maps are dependent upon good data, and it is unavoidable that to improve the speed of index creation that we need to improve the quality of the data. This is done by adding additional feature classes to the core datasets that will assist later in the indexing process.
For many of the Jacaranda Atlas maps we used the global open source Natural Earth Data. This is a great resource that continues to improve. Additionally, the Australian maps used Geoscience Australia data.
The Workflow
The basic workflow proposed is to store all spatial datasets in a master PostGIS database (this could also be an Esri file geodatabase), for import into the master Adobe Illustrator (AI) working files. The master AI files contain all the text layers (no elements, but data structures have been defined) graphic styles, symbols, character styles, MAP Themes, MAP Selections and MAP Views required.
When data is imported into the master AI file, the geographic extents of the data can be defined so that data can be clipped to the map frame. Map features are automatically styled as the MAPublisher MAP Themes have pre-defined styles based on layer attributes. This ensures graphical consistency across all maps.
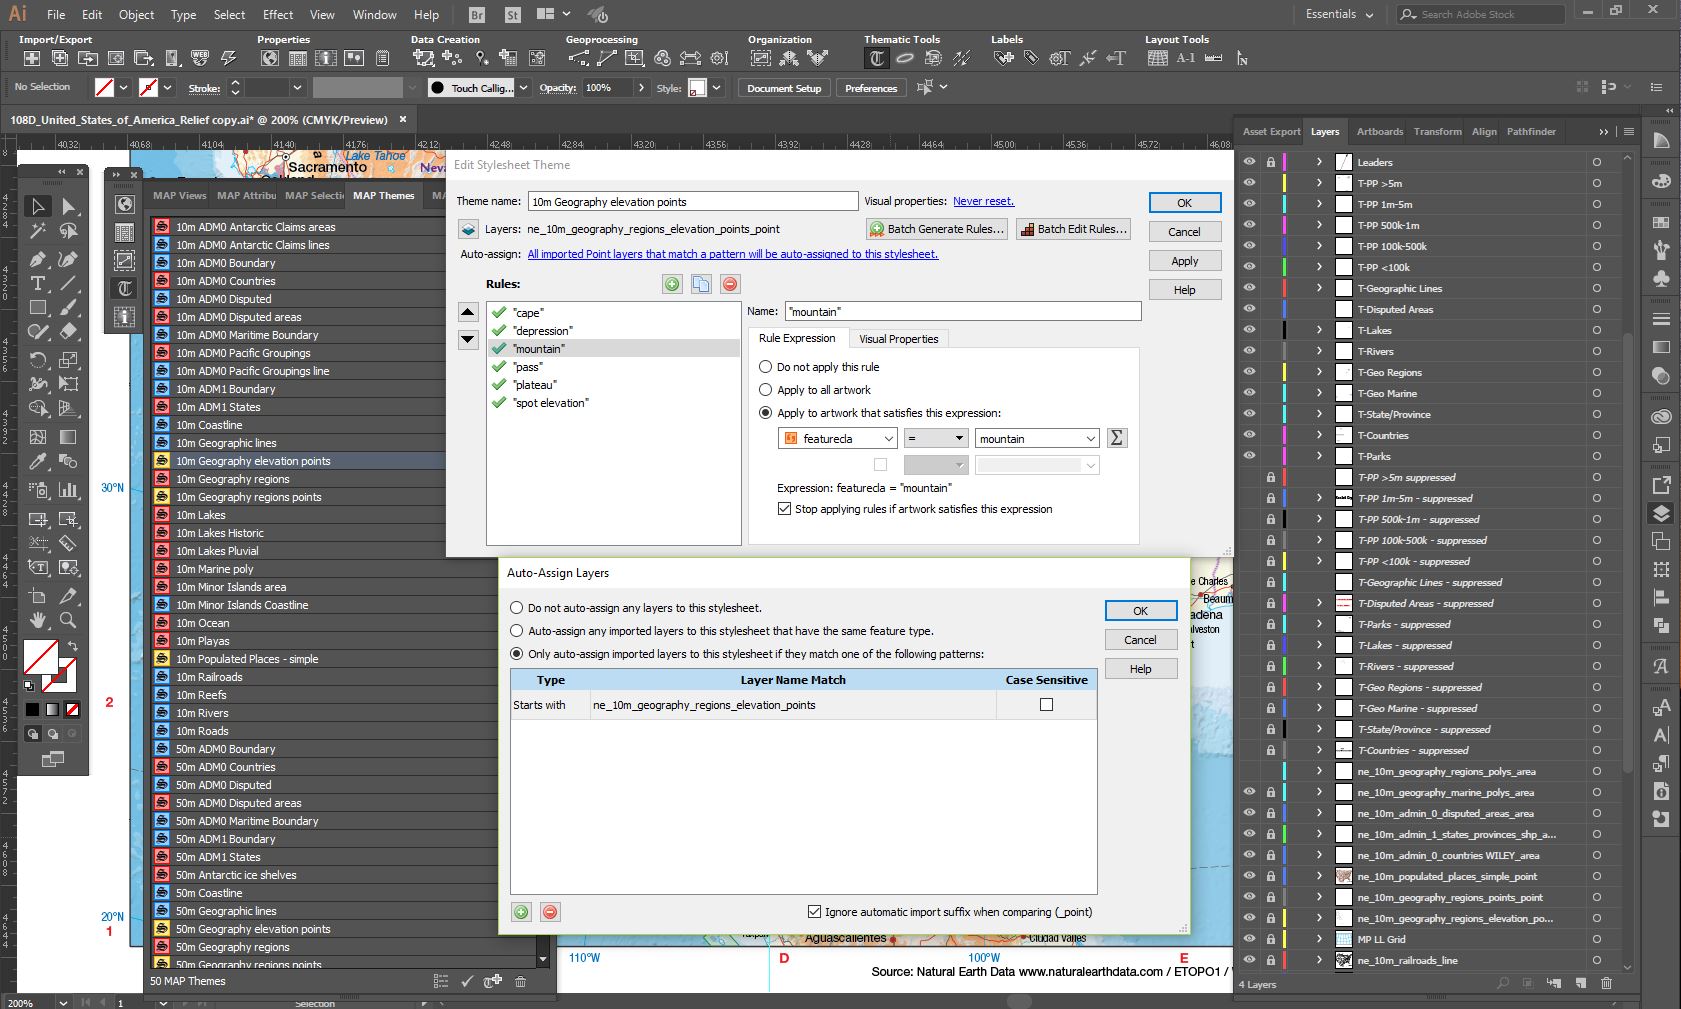
Figure 2 – MAP Themes allowing automated styling of data on import
Label Layers and Process
The label layers require the data structure of the layers to be pre-defined. This can be achieved in MAPublisher using the editor in the MAP Attributes palette. Place an object on the text layer and create the required layers. For the atlas maps we add the following additional layers that assist in indexing:
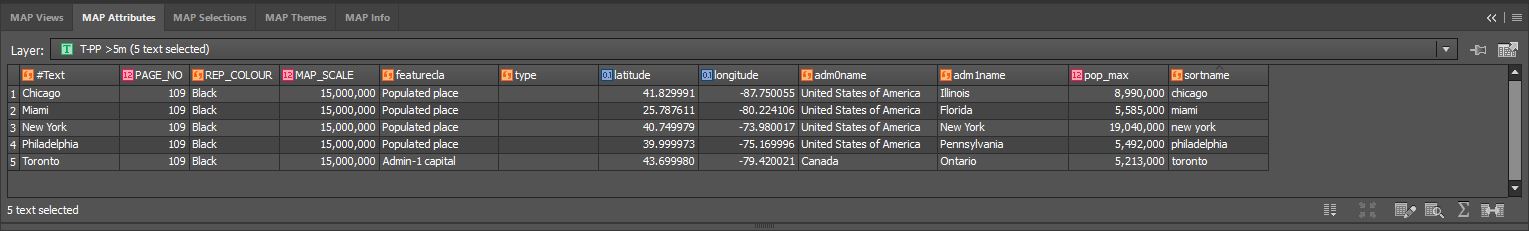
Figure 3: Custom feature classes added to text features. These fields are automatically populated when the text is generated using LabelPro
The layers shown in lower case have been extracted from the data.
The sortname column is one that we have created that allows indexing of the label in its preferred location in the gazetteer index. For example, features such as mountains that are labelled Mt. Kosciuszko on the map would be indexed as Kosciuszko, Mount in the gazetteer index. The sortname for Mount Kosciuszko would be kosciuszkomount.
Point features in the data have a latitude and longitude feature class defined in decimal degrees. We use this data to create a degrees and minutes value for the feature in the index.
The PAGE_NO data is manually added in the AI artwork. When we know which page the map is placed (a map may spread across two pages, in which case we add a guide defining the page gutter. Text is positioned so that it doesn’t fall within the gutter. Text on the left of the guide will fall on an even-numbered page, whilst text on the right of the guide will be an odd-numbered page) the text features are selected and using MAPublisher’s Find and Replace function in the MAP Attributes palette we can add the odd and even page numbers.
The REP_COLOUR feature class allows us to define the colour the index label will be in the gazetteer index. Land-based geographic features (mountains, capes, ranges, etc) are shown in brown, water-based geographic features (lakes, rivers, bays, seas and oceans) are shown in blue, World Heritage Areas are shown in green, and cities and towns are shown in black.
The MAP_SCALE feature class contains the numeric number of the map scale, e.g. 15,000,000. When we have multiple instances of the same feature we use the MAP_SCALE to select the best scale the feature is represented on and remove the other duplicates.
Where multiple cities or towns have the same name but a different location, such as Richmond (Australia – Tasmania, Victoria, New South Wales, Queensland and South Australia; New Zealand; United States – Utah, Virginia) we need to differentiate these by specifying the country followed by the state or province. The adm0name (country) and adm1name (state) are pulled from the Natural Earth Data to facilitate this differentiation.
With our text data structures in place and the data imported and styled in AI document, we can now label the map using MAPublisher’s LabelPro extension. LabelPro is a rule-based auto-labelling engine that can quickly and easily place labels on the map using the attribute information in the data. Setting up the rules for each layer can be time consuming, however this is still faster and more accurate than labelling the map by hand.
During the auto-labelling process any labels that can’t be placed are placed on suppression layers. These suppression layers need to have the same data structure as your other text layers. During the map cleanup process, some labels may need to be either repositioned, deleted or added. Rather than delete a label we move this label to its relative suppression layer. Likewise, if a label needs to be added, we take the label from the suppression layer and place it on the visible label layer. In this way attribute information is retained for all labels.
During this labelling process, because we have pre-defined our feature classes in the text layers, all the data from those matching fields will be added to our labels. From our list above, the featurecla, type, latitude, longitude, adm0name, adm1name, pop_maxand sortname columns will be populated with data (where the data exists).
An important consideration in map labelling is the tracking and kerning of labels. Large area features, such as deserts, ranges and oceans will have the tracking (space between characters) increased so that the label can spread across or along the feature. Kerning adds individual space between two characters. We increase the kerning between the last letter of a word and the space between the next word, rather than add spaces. In this way the label string is fit for use in the gazetteer index.
Figure 4 – Tracking and kerning settings for labels (in this case ROCKY MOUNTAINS) ensures clean indexes
Label positions are indexed using an alpha-numeric reference. The alpha references run left to right, whilst the numeric references run bottom to top from the bottom left corner of the map. The location of the first character of the label is referenced in this manner. Note also, that because this is a student atlas, the alpha references of ‘I’ and ‘O’ are included. In some atlases these letters are not used because of the confusion with the numerals ‘1’ and ‘0’, however for students this can be misleading by leaving them out.
Indexing in MAPublisher
Once we have our map labels finalised and the maps have been checked through the editorial process we can begin the indexing. MAPublisher has an indexing tool that can create an alpha-numeric index based on a pre-defined grid in the artwork. In the atlas we use that latitude and longitude graticule as the index grid. This can vary from a rectangular grid on a map using the Mercator projection, to a curved grid on a map using a conical projection. In most cases, we can use the MAPublisher grid, however there are some instances where the auto-created grid will not conform to our requirements. You can also use a custom area layer to define as a grid. Each grid cell needs to be defined with an alpha-numeric value so that indexing can be done.
With a grid selected, the final step in the indexing process is to define which fields will be added to the index table. By selecting all our custom fields we can create a .csv file that contains all the data required for the final collation in Microsoft Excel.
This indexing step needs to be done for each AI file. Each index .csv file is then converted to an Excel file which are then aggregated into one master gazetteer index document. In the final master index, fields like the latitude and longitude fields in decimal degrees are converted to degrees, minutes format using a simple formula (link). Fields are concatenated together and styled in Excel to create a final list which is exported as a Word doc for placement into Adobe InDesign.
The benefits of the approach taken are:
- ALL features on the final map artwork are indexed
- Any labels that are edited on the map are reflected in the index
- Additional data fields in the map labels reduces indexing processing time at the time-critical end of the project
- Complex grids can be indexed easily
- The whole map production and index generation process can be done in one software environment
If you have any more questions regarding this workflow please contact Spatial Vision.
- Case Study: GIS Service Plan - July 24, 2024
- Climate Change Statement - November 9, 2021
- Welcome Ryanne Firme – Digital Cadastre Modernisation Team - May 21, 2021