What a time to be a user or developer of GIS! To re-use an overused, but no less true turn of phrase, we’re seeing the ‘democratisation’ of spatial data (does it help I imagined saying that through gritted teeth?). Data is being made freely and widely available, but also key to the success of this is how we access, consume and exploit it.
It’s also due in large part to the many great platforms, tools and frameworks from vendors and open source projects alike. Tools and frameworks like Leaflet and OpenLayers are ubiquitous, and for good reason, they reduce the barrier to usage; all you need is a web browser, no 3rd party plugins (sorry Flash) just good old wholesome web and OGC standards.
Through these platforms and frameworks we can view, analyse and even manage the processing of data from the web browser; sophisticated tasks that used to be constrained to the desktop. The experience is no less rich, in fact its enhanced, we can easily integrate a wealth of data, services and media, dare I say it’s the perfect multimedia platform (did I just say multimedia, has anyone said that since 1995?!).
What is Cesium?
Anyway, let’s not bury the lead any further… another great framework that’s rapidly becoming a darling of the web GIS scene is CesiumJS, and for good reason. The TLDR version; it’s a plugin free web framework for creating virtual globes in the browser, think Google Earth or Nasa Worldwind, but it’s open source and has a wealth of promising capabilities and data support.
The tech stuff first: it uses WebGL, that’s the underlying HTML5 magic that lets you render great 3d in the browser (a far cry from the dark ages of 3d on the web comprising VRML and X3D).
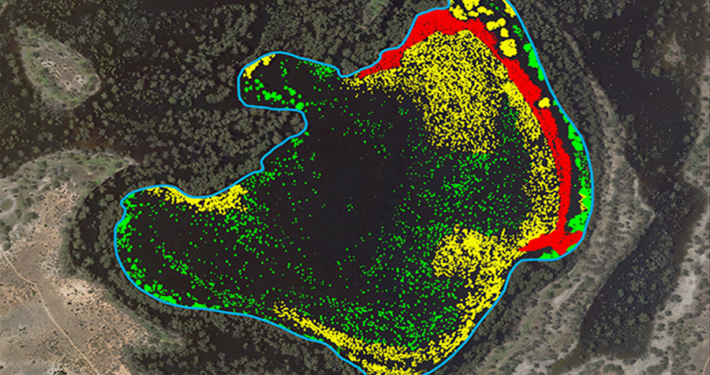
For the data nerds, it supports loading a wide range of data, including the usual suspects: points, lines, polygons & rasters. As a 3d globe it also supports 3d terrain, some freely available, or you can generate your own if you don’t mind getting your hands dirty. Who needs a DEM and hillshade when you can enable realistic lighting that interacts with your terrain in real-time?!
It also supports 4d, if you were like me and went “4d… huh?” well that just means you can throw time in to the mix, i.e. you can interact with your data with regards to time, think time series.
You may have already used CesiumJS out in the wild, it’s used in NationalMap (as part of the TerriaJS framework), and Spatial Vision have been implementing a soon to be released 2d/3d capability for a client that also incorporates it.
3D Capabilities
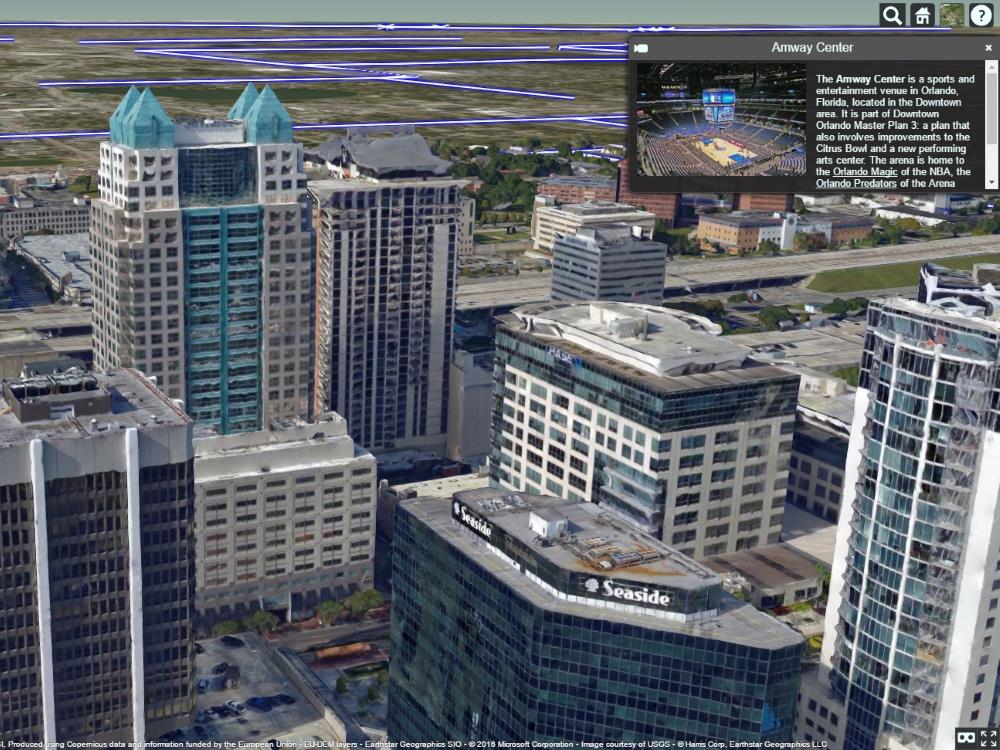
If the number of GitHub projects utilising it out in the wild are any indication, you’re certainly going to see much broader use before too long. Some of the notable projects include a framework for synchronising it with OpenLayers; load your data in OpenLayers and toggle between 2d and 3d views with ease. Others of note include; display of 3d cities and CityGML, point clouds, and there’s even a plugin for using it for VR with the Oculus Rift!
I encourage you to check out the CesiumJS website, or just search GitHub for some inspiration, there are some wacky, weird and downright cool applications being thought of. At the very least, keep it in your back pocket, it’s another capable open source tool that might be of use on your next project.
For further information, please contact Spatial Vision at info@spatialvision.com.au
- Case Study: GIS Service Plan - July 24, 2024
- Climate Change Statement - November 9, 2021
- Welcome Ryanne Firme – Digital Cadastre Modernisation Team - May 21, 2021