The Tale Of Two Cities
How is Melbourne changing, and how do we best plan for this change?
Melbourne is rapidly growing, with another 95,600 Melbournians added in the 12 months to October 2015, and with the city set to overtake Sydney as Australia’s largest city by 2056. The population increased 1.7% in 2015 to 4.4 million and is expected to reach 9.1 million by 2056. What impact will this rapid growth have on the delivery of services and the livability of the city? To answer these questions, we need to know where changes in housing are occurring.
To monitor these changes, the Victorian state government conducts an annual count of all new housing across Greater Melbourne, and prepares what is known as the Housing Development Data. The latest installment in this project used aerial photography to quantify new housing construction for the years 2013 and 2014. The data provides many insights into the type and scale of development that is occurring, selected examples of which are presented here. For instance, it tells the tale of at least two different Melbournes – the inner city story and what is happening along the outer fringe.
New housing in inner Melbourne is characterized by significant consolidation, and industrial land redevelopment, where apartments and smaller lot sizes are the result of many people wanting to live closer to where they work or services. Consequently there is a focus on development around transport hubs.
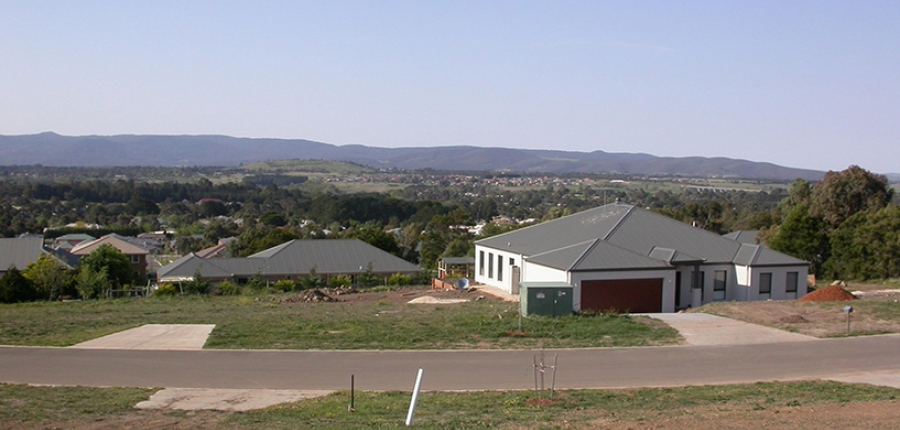
The second story, or city, is about new estates on the edge of Melbourne, with large tracts of agricultural land being converted to housing. It is here that lot sizes are larger and, while the air may be fresher, the exposure to the realities of rural living, such as the risk of grass or bushfire, for example, are felt the greatest. The Housing Development Data (HDD) project is concerned with identifying the change in dwelling stock within a 12-month period. It identifies demolitions and new construction, and hence the net change in housing stock. It is also concerned with the types of development projects with which this change is associated. HDD data has been collected annually since 2004. The latest instalment permits the changes we have felt but not seen quantified and mapped over the last decade to be presented.
The remainder of this article focusses on two examples of what this data has to say about the inner city suburb of Brunswick and the relatively new suburb of Mernda.
Brunswick
The Brunswick story shows that there have been a significant number of larger developments in recent year in areas. These developments are often on the edge of established residential areas, where former industrial or commercial land is being made available for residential purposes. In Brunswick, a significant number of these are also close to major rail and tram routes. In Figure 1a presents the size of housing development projects where the darker the color, the greater the number of dwellings constructed. Lighter colors, like yellow indicate individual house or other smaller housing stock conversions. These smaller developments are more closely associated with the established residential areas. The numbers on each housing project identify the total number of dwellings constructed as at 2014. Figure 1b indicates the year the housing development project was first identified, with the darker the color, the more recent the housing project. The data identifies 255 demolitions and 2,325 new dwelling constructions in Brunswick for the 10 year period. A significant number of apartment constructions identified in red and salmon color are along Sydney Road and the adjacent rail corridor to the west, as expected.
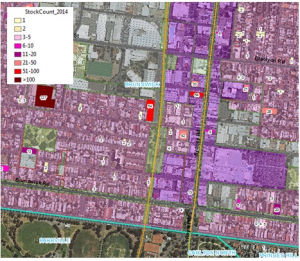
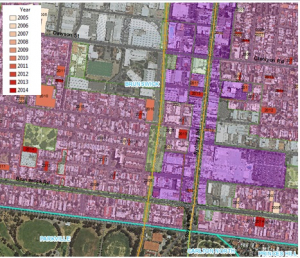
Figure 1 Brunswick housing development 2004 to 2014 – top view (Figure 1a) shows housing projects classified by size, and bottom view (Figure 1b) the same projects classified by year of establishment
Mernda
In Mernda there have been large tracks of land released in recent years associated with large housing development projects in many instances comprising in excess of 100 dwellings each. The data shows how for the 10-year period to 2014 there were very few (21) house demolitions, and 4,804 new constructions for the same period. Figure 2 presents a view of the housing development projects close to the newly proposed Mernda railway station. It appears the new rail line to Mernda (shown in yellow) which will be an extension of the current South Morang line, will be a very welcomed and timely development. Work on this rail extension will commence this year and is scheduled for completion in 2019. And of course the rail line is just one of the many side stories in planning for, and appropriately servicing Melbourne’s growth. Figure 2 also presents the size of each of the housing projects in terms of the number of dwellings constructed by a housing development projects and the year the project was initially identified. The actual number of dwellings constructed is indicated by the number presented in each housing project location.
Quantifying the Change
Housing development in the two example suburbs is also presented in Figures 3 to 5 which summarise the profile of housing stock changes for the 10-year period 2005 to 2014. Figure 3 contrasts the differences in both demolitions and construction for these two suburbs. They show, as anticipated, a greater number of demolitions in Brunswick, and an intense build up in construction in Mernda since 2004. Interestingly, the global financial crisis appeared to have a greater impact in the growth areas such as Mernda, than in the more established areas, like Brunswick.
Figure 4 illustrates one of the key contrasts between the two suburbs. It shows how the average land area per constructed dwelling between 2004 and 2014 for Brunswick was 77 sq.m., while for Mernda it was 2,091 sq.m.
Another key difference between the two suburbs is the size of housing projects. For Mernda the majority of constructed dwellings (92%) for the 10-year period was via large scale property development projects of more than 100 dwellings. For Brunswick, this same project class contributes only 22.5% of total newly constructed dwellings.
Housing Development Data
The Housing Development Data continues to be an essential resource in planning for a rapidly changing Melbourne, and addressing the challenges of service delivery and livability. To achieve this, we need to know where changes in housing, the foundation on which communities are forged, is occurring.
Spatial Vision recently produced the 2013 and 2014 Housing Development Data (HDD) project for the Planning Division within the Victorian Department of Environment, Land, Water & Planning (DWELP). HDD data will be made publicly available through data.vic.gov.au by mid-2016.
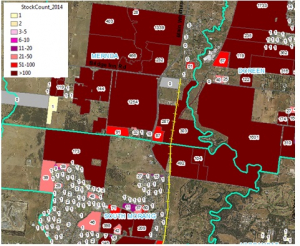
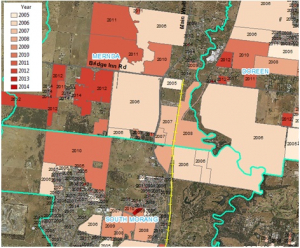
Figure 2 The Mernda housing development story 2004 to 2014 – top view shows housing projects classified by size, and bottom view the same projects classified by year of establishment
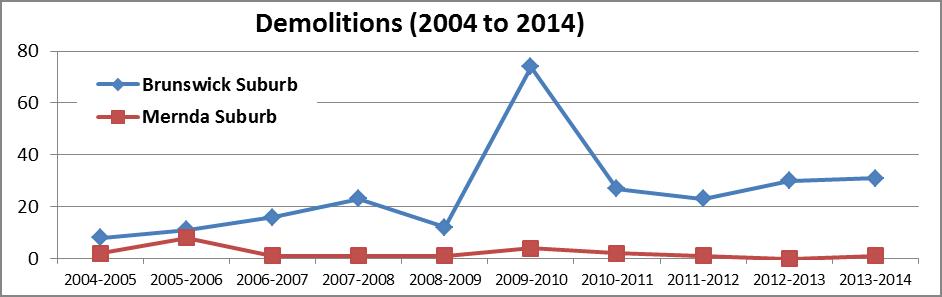
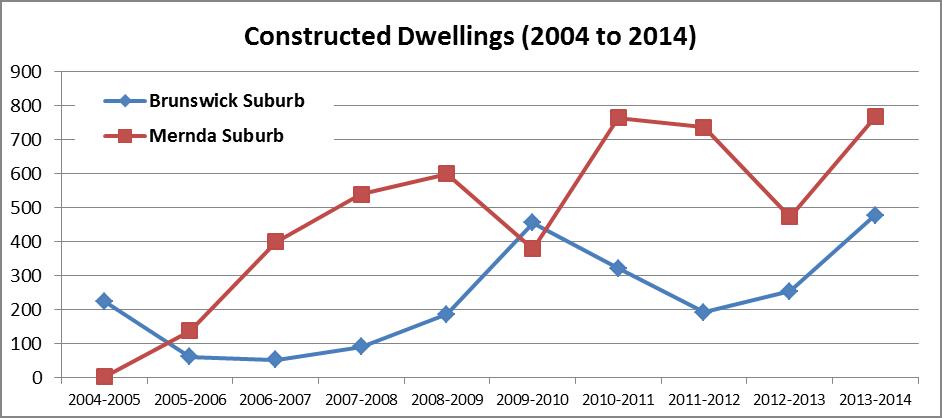
Figure 3 Summary of housing stock changes between 2004 to 2014 for the suburbs of Brunswick and Mernda
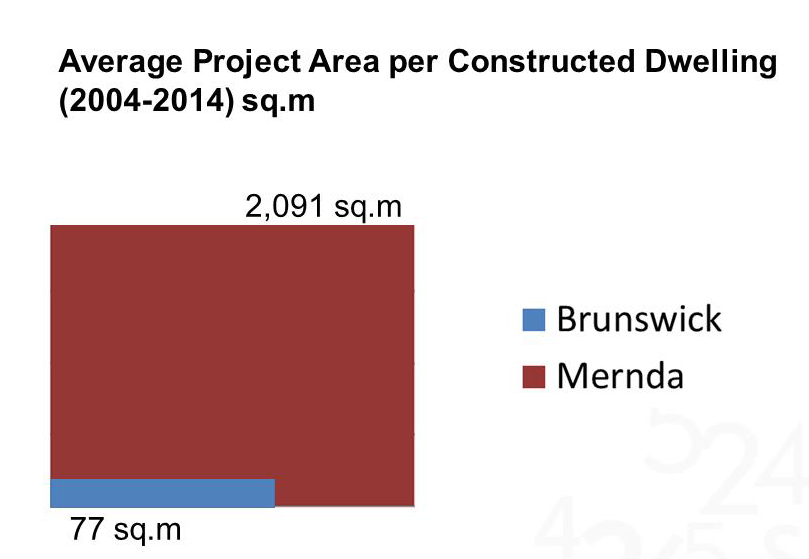
Figure 4 Average Housing Development Project area (sq.m.) per constructed dwelling between 2004 and 2014 for Brunswick and Mernda.
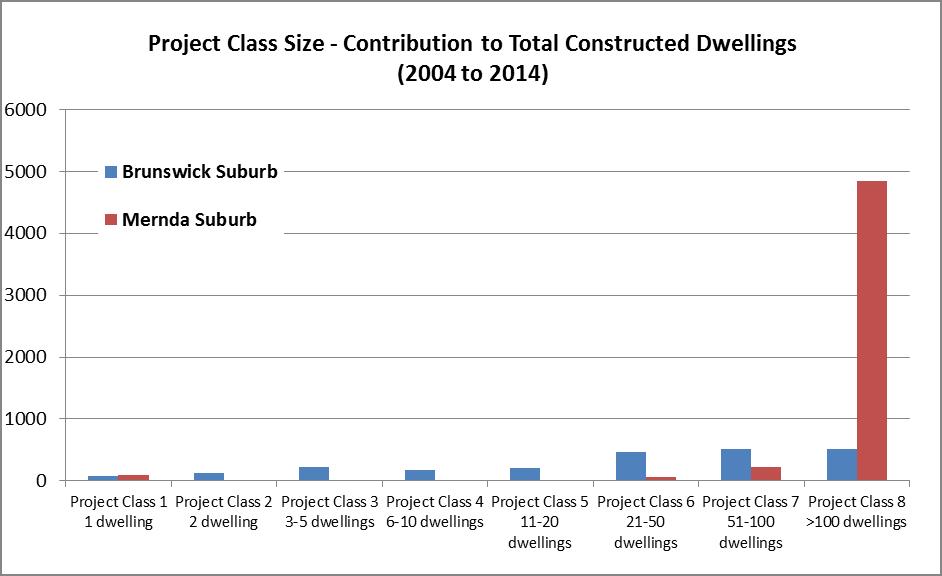
Figure 5 Contribution of different housing project sizes to housing stock changes between 2004 to 2014 for the suburbs of Brunswick and Mernda
For more information, please get in touch