Damaging and disruptive, coastal flooding is becoming an increasingly unruly and regular component of coastal living as sea levels rise.
What does the data say about coastal flooding?
Mean sea level rise is becoming a key focus of attention globally with sea levels expected to rise approximately 15-30cm by 2050, and 70cm by 2100 given a ‘business as usual’ approach to carbon emission reduction (IPCC, 2021).
With approximately 11% of the Australian population living below 10m above sea level (SEDAC, 2013), these sea level rise projections are of particular concern. At a local scale, elevated sea levels are exacerbated by daily tidal fluctuations. Flooding as a result of these daily movements is generally called ‘nuisance flooding’ however combined with sea level rise, it will become far more than a nuisance.
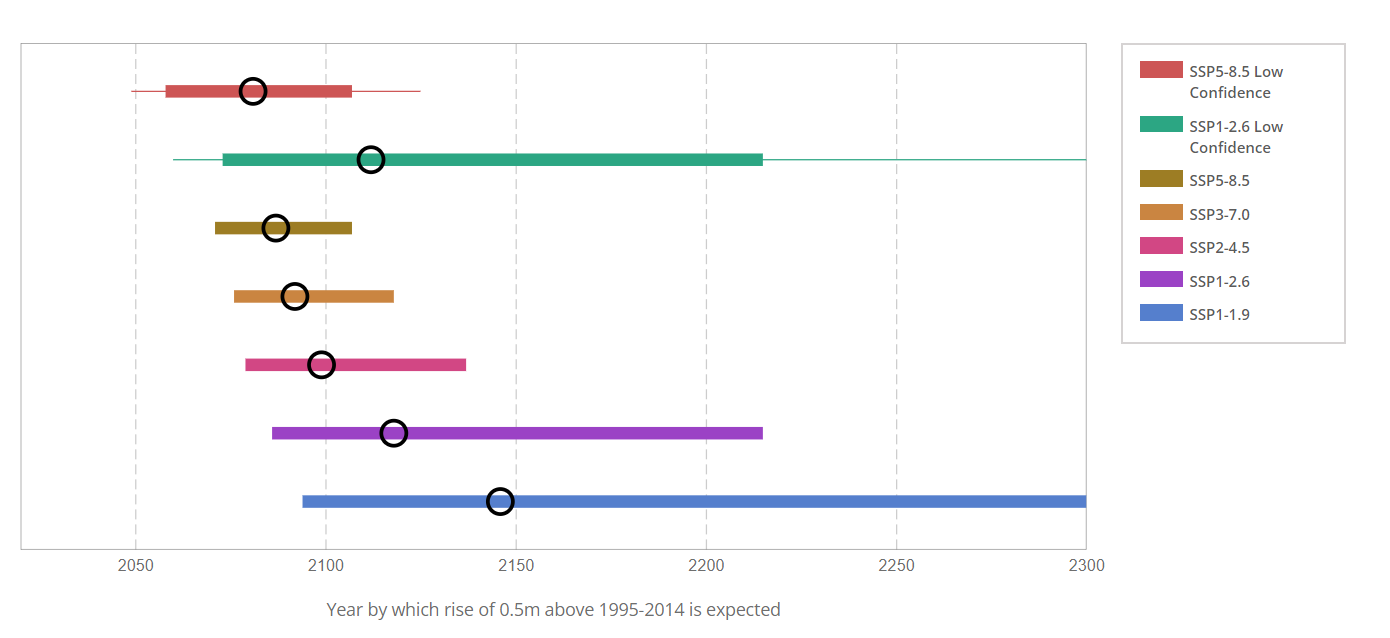
Projected timing of sea level rise to reach 0.5m for each of the Shared Socio-Economic Pathways (SSPs) for Lorne, Victoria. SSP5-8.5 and SSP2-4.5 are assessed by Spatial Vision in this research (source).
What’s at risk?
As sea level rise accelerates, maximum daily tides, king tide and storm surge events will reach higher and further inland, eroding natural environments (such as beaches and wetlands) and labelling low-lying infrastructure (such as private properties, storm water, sewerage systems and roads) impractical liabilities. Snowballing environmental and financial costs as a result of regular, extreme (by current standards) sea level events will be substantial.
So how can we mitigate coastal flooding risks?
Flood mapping, risk and climate analysis are critical in developing our understanding of climate change impacts, and informing key adaptation and mitigation decisions at a community scale.
Looking at the issue of coastal flooding through different lenses can help us predict not only where we’ll see flooding, but how often.
Recent research conducted by Spatial Vision demonstrates how we can bring together different data perspectives to understand ‘how often’ we will likely see extreme sea levels occur, year to year into the future.
And how often will we see coastal flooding occur?
Focusing on inundation frequency paints a compelling picture of our future. Using the most recent Intergovernmental Panel on Climate Change’s (IPCC) sea level rise projections, published in August 2021 as part of the Sixth intergovernmental report, we can predict how often current extreme sea levels will be exceeded in Port Phillip Bay.
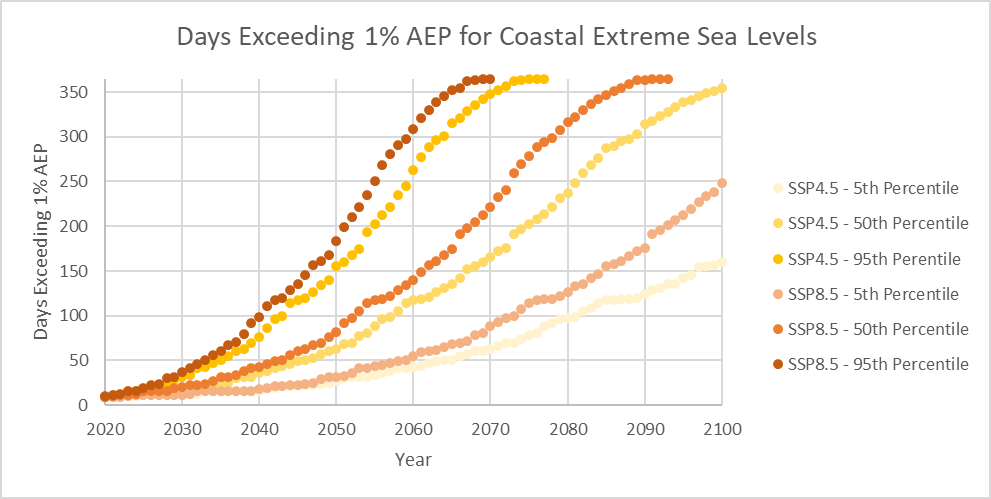
Incidence of sea levels exceeding 1% Annual Exceedance Probabilities (AEPs) in Port Phillip Bay using SSP4.5 and 8.5 – 5th,50th (median) and 95th percentiles, 2020-2100
Annual Exceedance Probabilities (AEPs) represent the probability of an event occurring in any given year. In this context, we looked at the AEP of extreme sea level events for the time period of 1995-2015 across Port Phillip Bay.
Given sea level rise according to different Shared Socio-Economic Pathways (SSP’s) or ‘future emission scenarios’, we can see the number of days per year an ‘extreme’ sea level event as a result regular storm, wind and tide events rises exponentially. Infrastructure and communities which currently experience these sea level events extremely sporadically, will endure these on a weekly to daily basis by 2100 under the emission scenarios analysed.
| Year when AEP exceedance milestone reached | Days per year predicted tides exceed 5% AEP for extreme sea levels | ||||||
| 10 | 30 | 52 | 100 | 183 | 300 | 365 | |
| SSP4.5 – 5th Percentile | ** | ** | ** | ** | ** | ** | ** |
| SSP4.5 – 50th Percentile | 2072 | 2076 | 2082 | 2087 | 2094 | ** | ** |
| SSP4.5 – 95th Percentile | 2049 | 2051 | 2054 | 2060 | 2063 | 2070 | 2079 |
| SSP8.5 – 5th Percentile | 2096 | ** | ** | ** | ** | ** | ** |
| SSP8.5 – 50th Percentile | 2067 | 2069 | 2072 | 2078 | 2083 | 2089 | 2100 |
| SSP8.5 – 95th Percentile | 2047 | 2049 | 2051 | 2056 | 2060 | 2065 | 2072 |
** Milestone not reached in 2020-2100 period
This table shows the emergence year of projected tides exceeding 5% AEP for extreme sea levels for milestone days per year. 5% AEPs are calculated from 1995-2015 data
Even more alarming, if we consider the effect of daily tides alone, by the end of the century under the SSP scenarios 4.5 and 8.5 (IPCC, 2021), (excluding 4.5 – 5th percentile) we will see tides create sea level events that would be considered within the top 5% of sea level events for the 1995 to 2015 period. SSP8.5 (50th and 95th percentiles) see tides creating 5% AEP events every day before the end of the century.
The impact of this on the day-to-day lives of Port Phillip Bay’s low-elevation communities will be significant, and merits forward-thinking to adaptive rather than reactive measures.
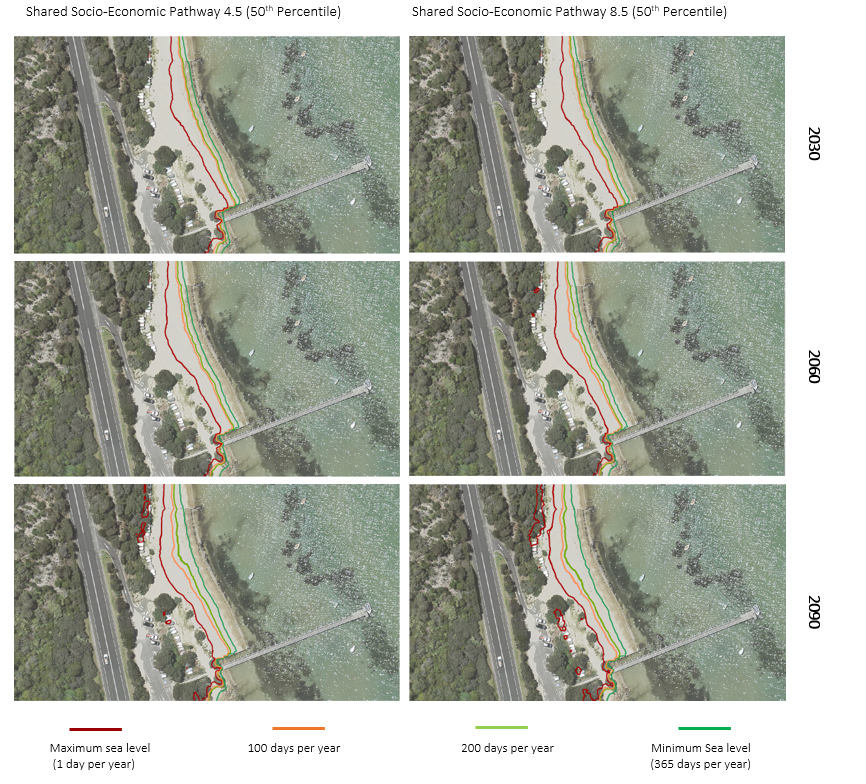
Maximum, 100 days per year, 200 days per year and Minimum sea levels at Sorrento Beach on the Mornington Peninsula in 2030, 2060 and 2090 using SSP 4.5 and 8.5 median projections.
Coupling frequency measurements with flood mapping highlights the alarming trends sea level rise presents to our low-elevation communities. This type of inundation frequency analysis is valuable and can assist in key decision-making and adaptation planning measures, such as identifying at-risk assets requiring relocation to avoid scenarios of decision-makers being too early (unnecessary relocation) or too late (assets or homes becoming inhabitable due to regular flooding).
Overall, given the hazard sea level rise and extreme sea level events present to coastal communities, infrastructure and ecosystems, spatial data analysis and visualisation is critical to better understand and communicate the need for timely action.
References
IPCC, 2021: Climate Change 2021: The Physical Science Basis. Contribution of Working Group I to the Sixth Assessment Report of the Intergovernmental Panel on Climate Change: Masson-Delmotte, V., P. Zhai, A. Pirani, S.L. Connors, C. Péan, S. Berger, N. Caud, Y. Chen, L. Goldfarb, M.I. Gomis, M. Huang, K. Leitzell, E. Lonnoy, J.B.R. Matthews, T.K. Maycock, T. Waterfield, O. Yelekçi, R. Yu, and B. Zhou (eds.). Cambridge University Press. In Press.
Center for International Earth Science Information Network – CIESIN – Columbia University. 2013. Low Elevation Coastal Zone (LECZ) Urban-Rural Population and Land Area Estimates, Version 2. Palisades, NY: NASA Socioeconomic Data and Applications Center
Click here for more information about our climate change work.
David is passionate about all things GIS and contributing to resources and solutions that promote informed decision-making. Outside of the office, David enjoys catching up with friends, sport and getting outdoors.
- Rising Tides: What data can tell us about future coastal flooding - December 16, 2021
- The Journey of a GIS Graduate: 2021 Graduate Cadet Program - June 17, 2021