When we come to depict any spatial data in GIS, from physical assets and locations to real-world events and trends, there are two differing systems to display data; Raster and Vector representations. Both of these methods present data in their own format, with their own advantages and disadvantages.
Vector Data
Vector data is what most people think of when they consider spatial data. Data in this format consists of points, lines or polygons. At its simplest level, vector data comprises of individual points stored as coordinate pairs that indicate a physical location in the world. These points can be joined, in a particular order, to form lines or joined into closed areas to form polygons. Vector data is extremely useful for storing and representing data that has discrete boundaries, such as borders or building footprints, streets and other transport links, and location points. Ubiquitous online mapping portals, such as Google Maps and Open Street Maps, present data in this format.
Raster Data
Raster data provides a representation of the world as a surface divided up into a regular grid array, or cells, where each of these cells has an associated value. In an alternate sense, we can consider a digital photograph as an example of a raster dataset. Here each cell, which in this instance is referred to as a pixel, corresponds to a particular colour value. When transferred into a GIS setting, the cells in a raster grid can potentially represent other data values, such as temperature, rainfall or elevation. The main point of difference between the digital photograph and the GIS representation is that in the GIS there is accompanying data detailing where the cells can be found on a globe and how big these cells can be.
Satellite Imagery
Satellite imagery provides a perfect context example of this image vs. GIS setting. At a simple level, satellite imagery can be considered a digital photograph of the surface of the globe, each cell indicates a particular colour. But provide a geographical context and now we can position this correctly on a globe and then run analyses off the cell values which can be considered colour wavelength bands.
Raster datasets are useful in the storage a presentation of continuous data, such as weather events and climate projections, or elevation surfaces. In this vein, raster representation are more closely linked with representing physical properties or phenomena found on the globe.
Advantages and Disadvantages
In comparison between the two forms of data, there are particular advantages and disadvantages of use. Vector data is considered to be a more traditional method for cartographic representation, it delivers a representation that is sharp, clean and scalable. Also it is more visually aesthetically pleasing. Data is stored without any loss or generalisation and accurate geolocation information is preserved.
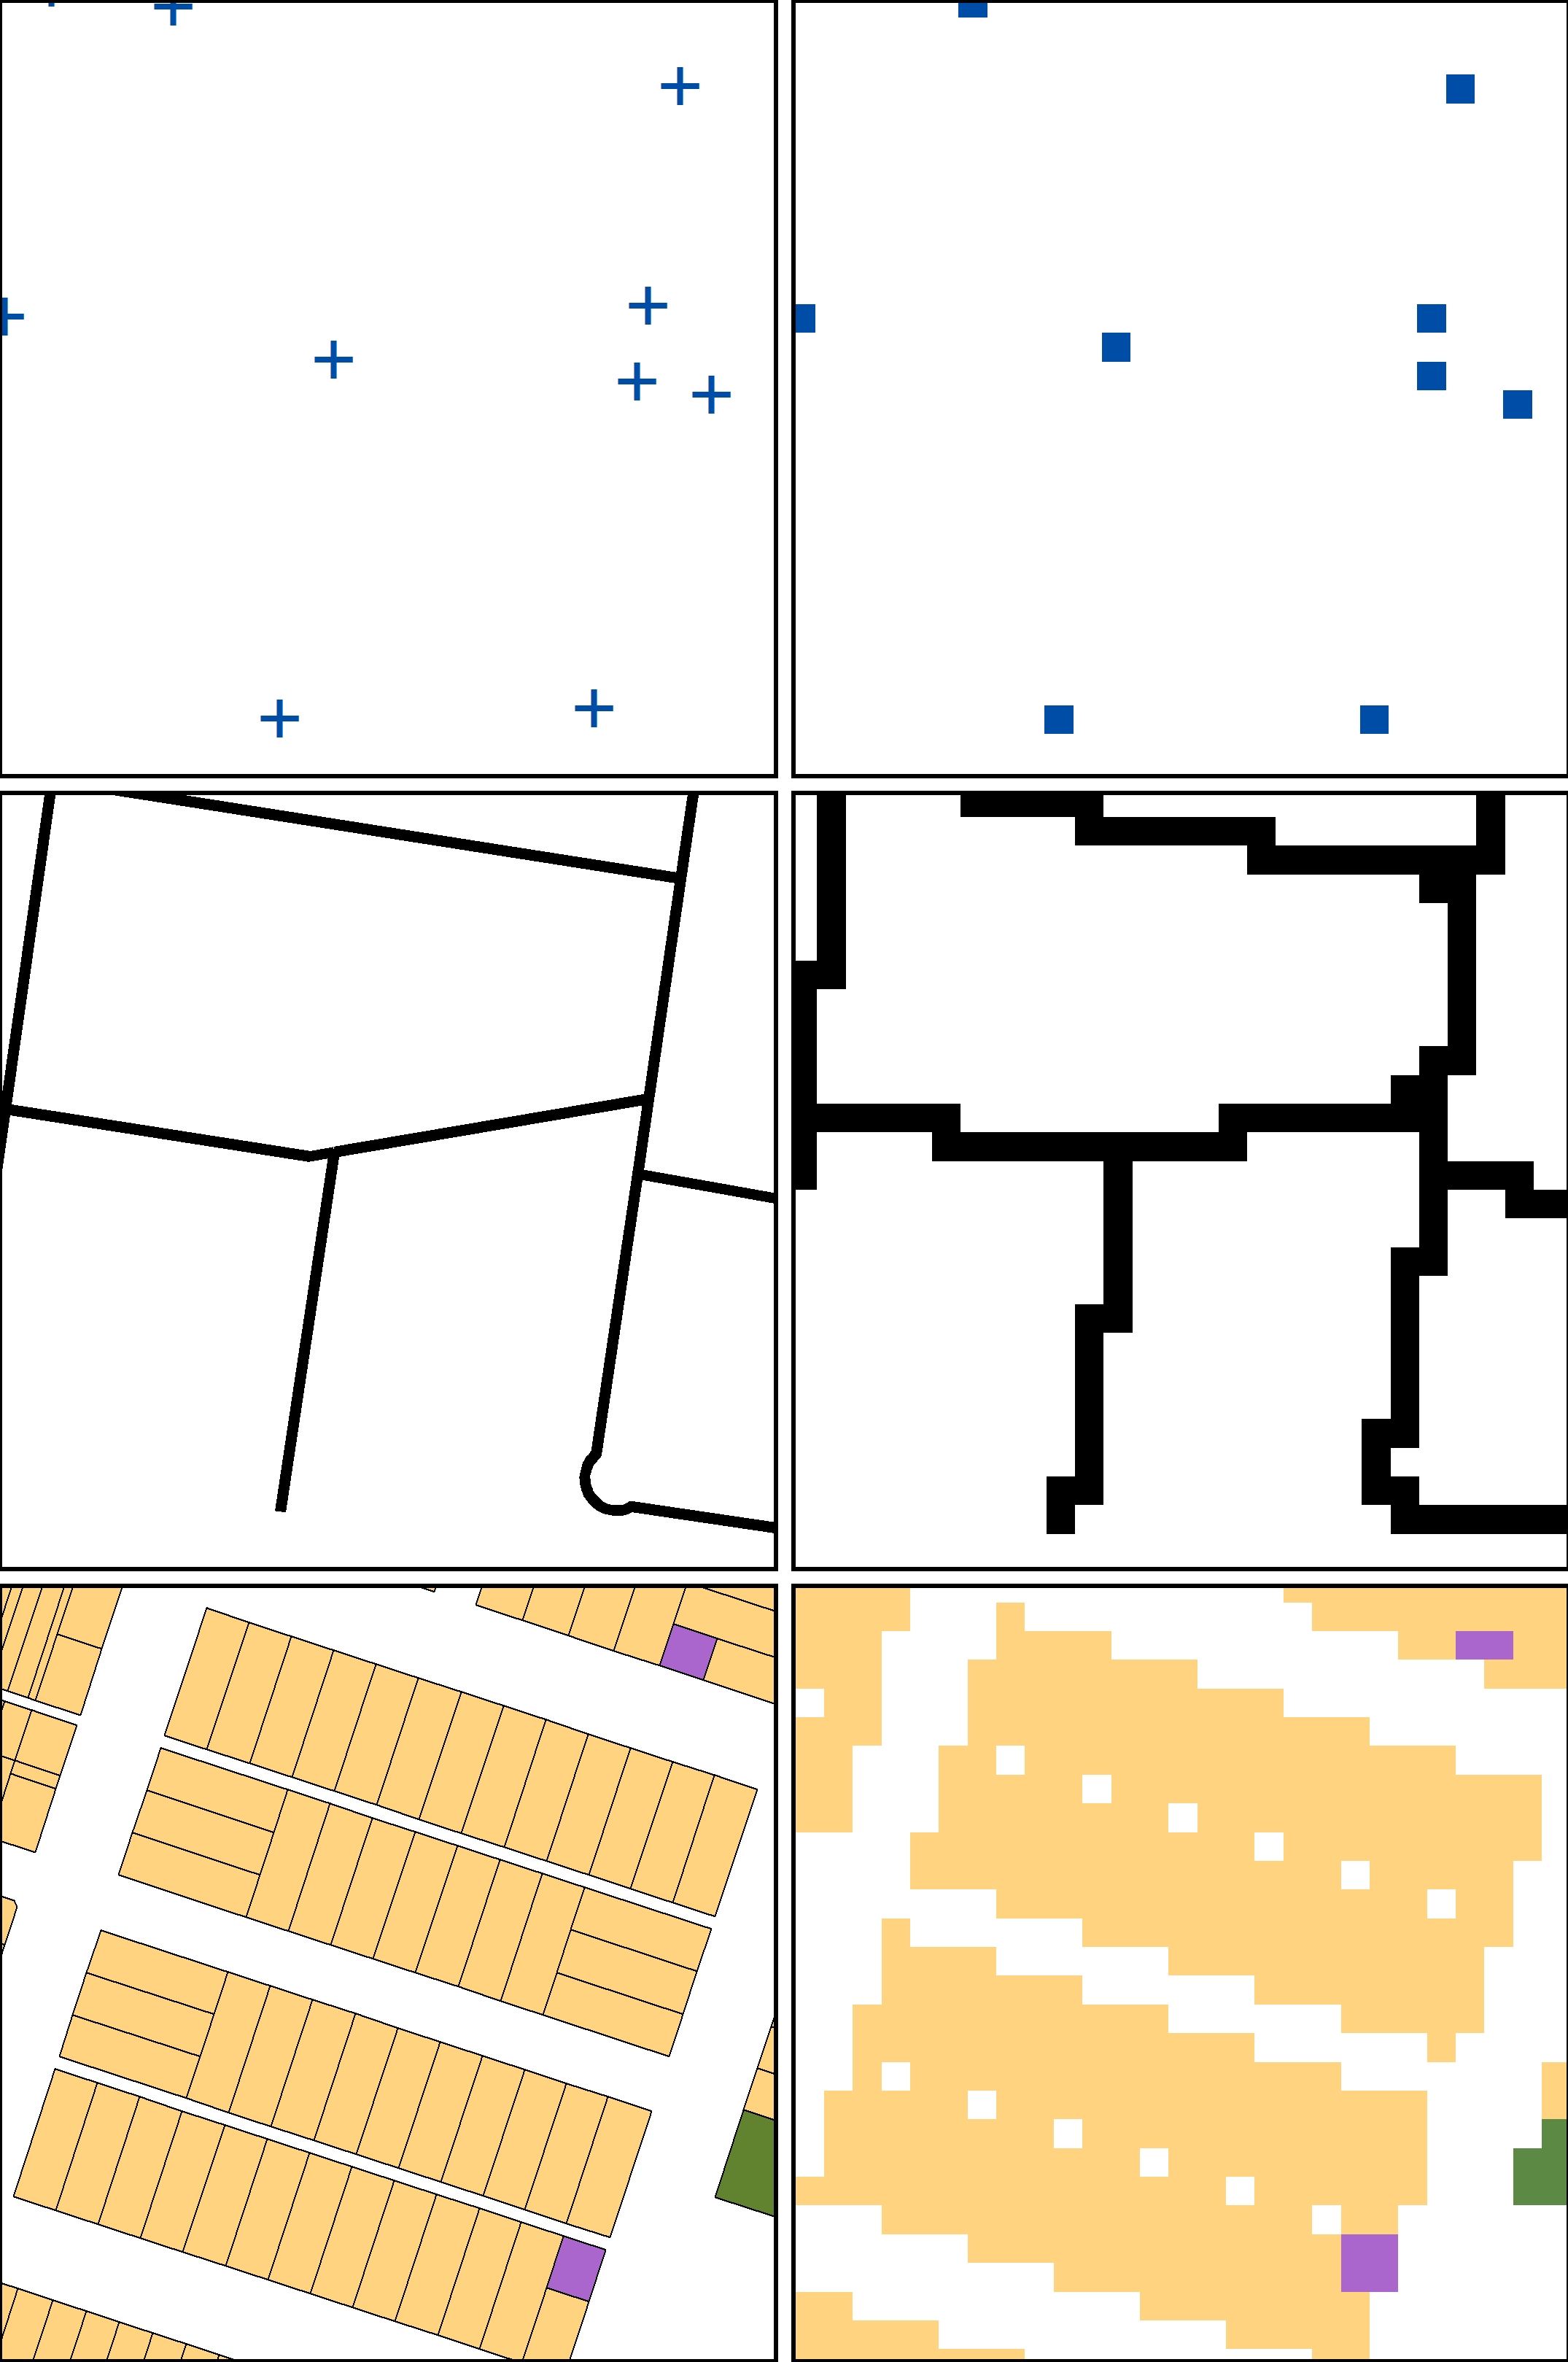
Figure 1: Highlighting the different way vector (left side) and raster (right side) represents data for point, line and area
Additionally, multiple attributes and data fields can be stored in vector features. However the processing and storage of vector data can be intensive. Due to the fact that vector data is stored as a series of points, each item needs to be stored and listed. Added to this, each point, or collections of points, can have associated data, which can add to vector storage and processing times. Topology representations can be useful in vector data, however it can often be processing intensive. Dependant on size and number of features, the editing and processing of vector data, either as a topology, or other format, can be quite time-consuming. Ultimately, with more features or points of data, the lengthier any edits can be and the more complex processes and algorithms become. Continuous type data is not efficiently presented and stored in vector format. Elevation can be depicted via spot heights, contour lines or polygon fills, but presented as a flowing surface, vector data can be mismatched.
Mathematical Modelling
Raster data is more suited to mathematical modelling and analyses. Due to the fact that raster surfaces represent one attribute or value, calculations, algorithms and quantitative processing can be very quick and simple to run. The grid surface is ideally suited for presenting and storing continuous values. Additionally, storage of rasters can be small due to the way it handles and stores its geographic location. The coordinates of each cell is inferred by its position within the grid network. All that is required, at minimum, is an origin point such as the top left corner, a grid cell size and number of rows and columns. This will position the gridded surface on a map projection or globe and furnish the correct size and representation.
One main pitfall of raster representations is grid cell size. Size designates the resolution of the gridded surface. A 10×10 kilometre grid cell is translated as only one unique value for every 10km2 square on the surface, the coarser the cell presents a blurrier depiction.
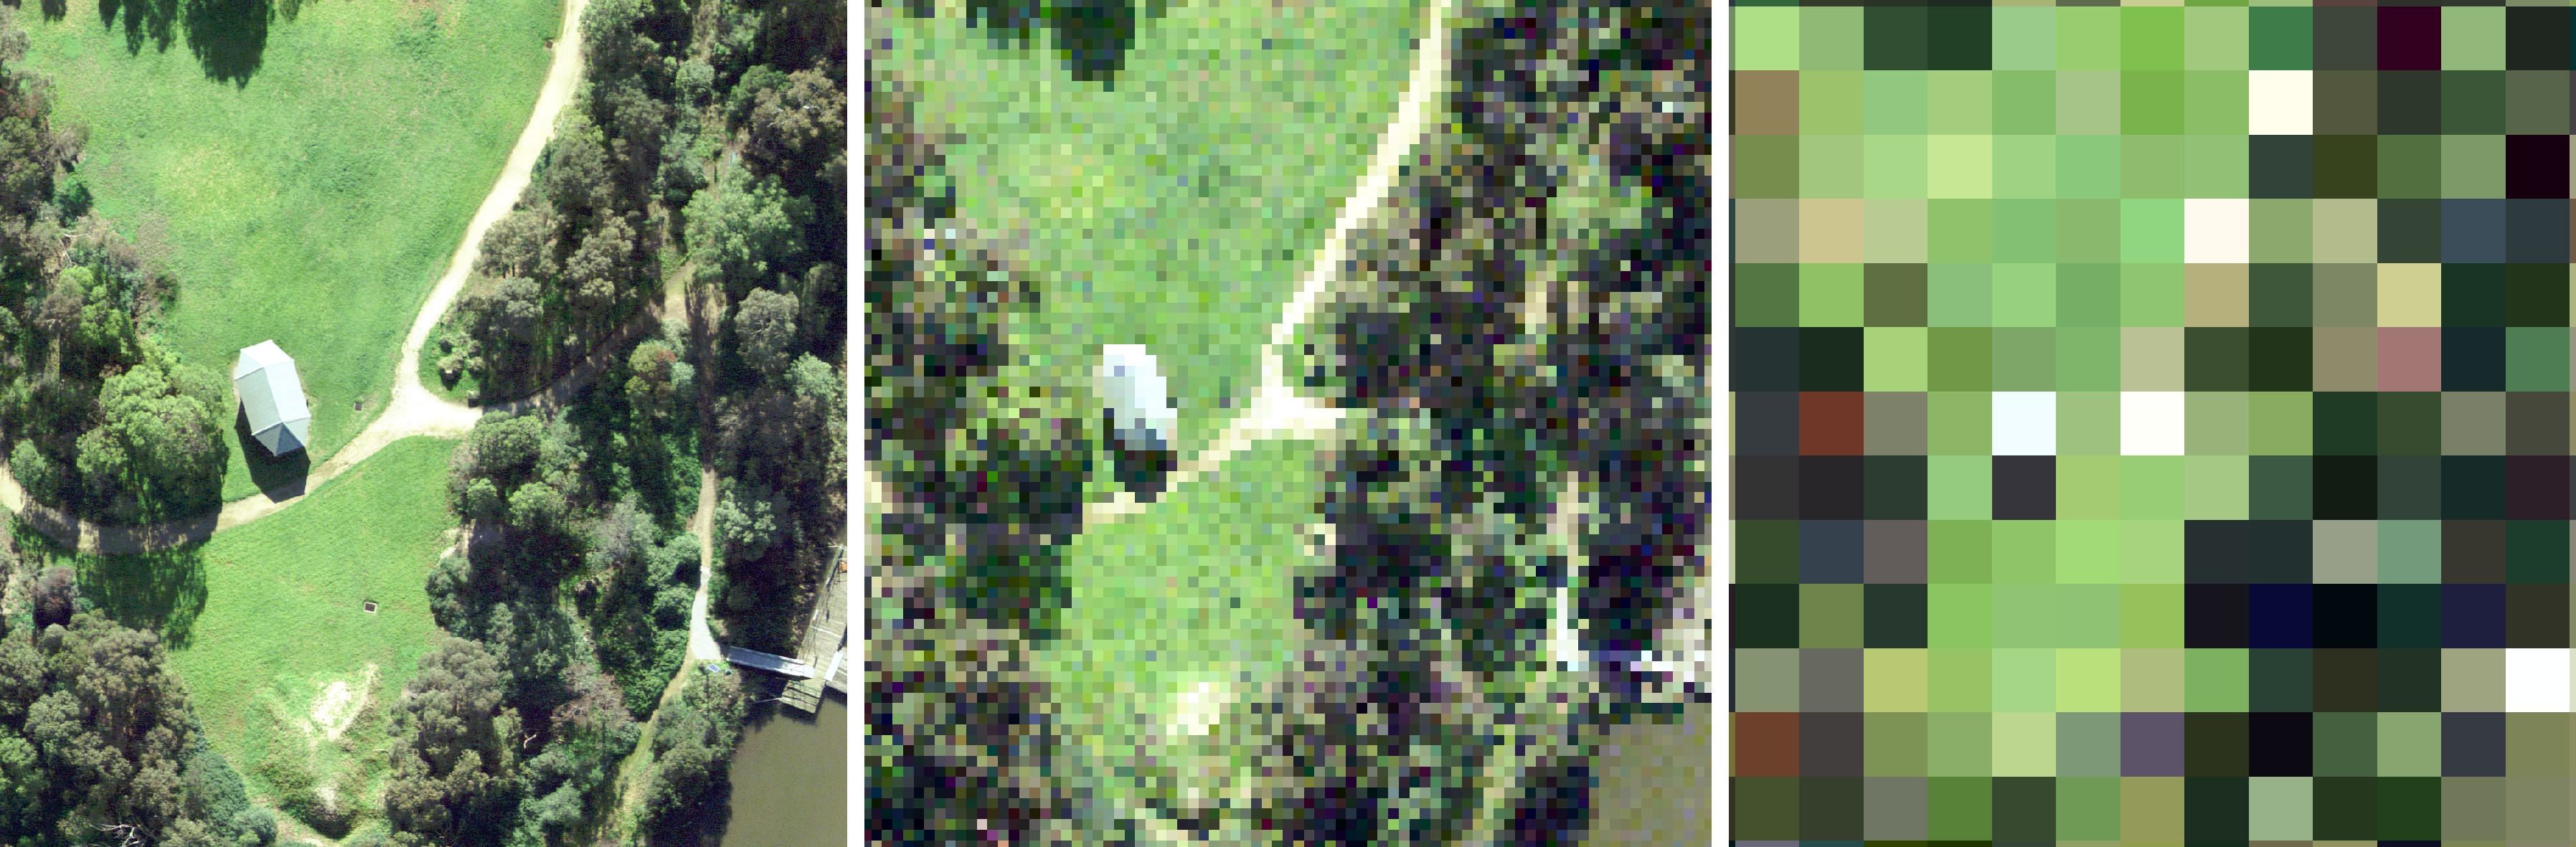
Figure 2: Different resolutions (cell size) of the same raster image. Left – 6cm cell size, Middle- 60cm cell size, Right- 6m cell size
Also as a consequence, size can determine of the storage size of the surface and the scale at which it can be used. A kilometre grid cell can be useful working at a regional or state wide level, but at the local or property parcel level this would be next to useless. Raster data, as mentioned, is more suited to continuous representations, at base it is only able to signify one characteristic. Smaller grid cells would provide a more detailed gridded surface, but end storage would be larger. This can lead to longer processing time. Dependant on grid resolution, it can be ill-suited to delineate linear or point features. Hence, processes involving networks and linkages are inappropriate for this data format. One last drawback to raster based data is that most spatial data, initially, is stored as vector based data. If it is necessary to work with it in raster format, there is a need to convert it. This can introduce data integrity issues if unsuitable grid cell sizes are used that simplify data. This can also lead to non-aesthetic or visually unappealing representations of spatial data.
So Which Is Best?
On the whole, the use and selection of raster or vector spatial data is dependent on the objective of the output and how that data is to be depicted. One format is not superior to the other, but each do have their uses provided they are used in the correct context. If the final mapping output is to deliver something more aligned with traditional cartographic representations, then vector based spatial data would be appropriate to form the base information. Whereas if the representation is more aligned to depicting a surface or some other physical phenomena or if there is a mathematical context or analyses to be undertaken, then raster data would be more suitable.
For further information, please contact Spatial Vision at info@spatialvision.com.au
Harmen is a skilled analyst and modeller with over 6 years of experience in Geospatial Analysis.He has a strong background in the ArcGIS environment, Python scripting and the application of automation in modelling processes for large datasets and series.This has most recently been applied in the evaluation and processing of environmental works program data across Victoria for the analysis of works size and alignment to best management practices.
- When to Raster vs When to Vector? A worked example - May 4, 2022
- Mapping the Future of Farming - August 9, 2019
- Great Ocean Road Erosion Impacts - January 10, 2019