Hot enough for you? Climate Heat Map of Australia released
Extreme heat is one of the most devastating effects of climate change, increasing fatalities, severe health issues, impacting our way of living and causing damage to the environment and ecosystems.
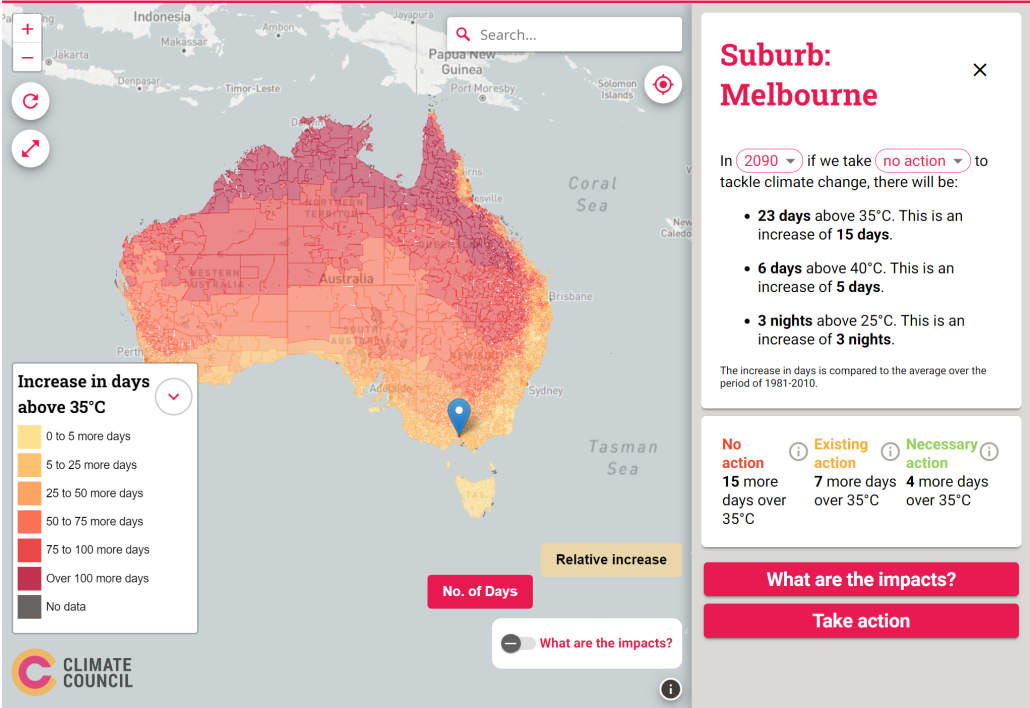
Today marks a timely release from the Climate Council, the Climate Heat Map of Australia. This interactive tool illustrates how cutting climate pollution will limit extreme heat in our neighbourhoods. The map does so by projecting the average number of hot and very hot days (and nights), for each suburb by 2050 and 2090 across three scenarios: no action, continuing with existing action, and taking necessary action in line with Climate Council’s recommendations.
Thousands of data points from CSIRO and the Bureau of Meteorology’s Climate Change in Australia project were analysed to produce the tool. Spatial Vision Geospatial Analyst Tom Hollands, who also worked on the award-winning Climate Risk Map for the Climate Council, explains the challenge of bringing this useful and persuasive tool to life.
“We needed to visualise a high volume of complex data, simply and clearly. Climate Council are experts in communication, so we focused on the user journey and how to tell the story in a way that was compelling and informative. The approach for the design was one that was honest and effective, leveraging previous experience in this field. Working in collaboration with the client to synthesise what they wanted to translate into user requirements, the focus was on the message and usability.”
According to Tom, the main technical challenge of visualising large-scale data (15k+ suburbs across Australia, with 39 data points each) was performance. Data was prepared using geometry simplification, and then split and indexed to ensure the map would display well on all devices and browsers.
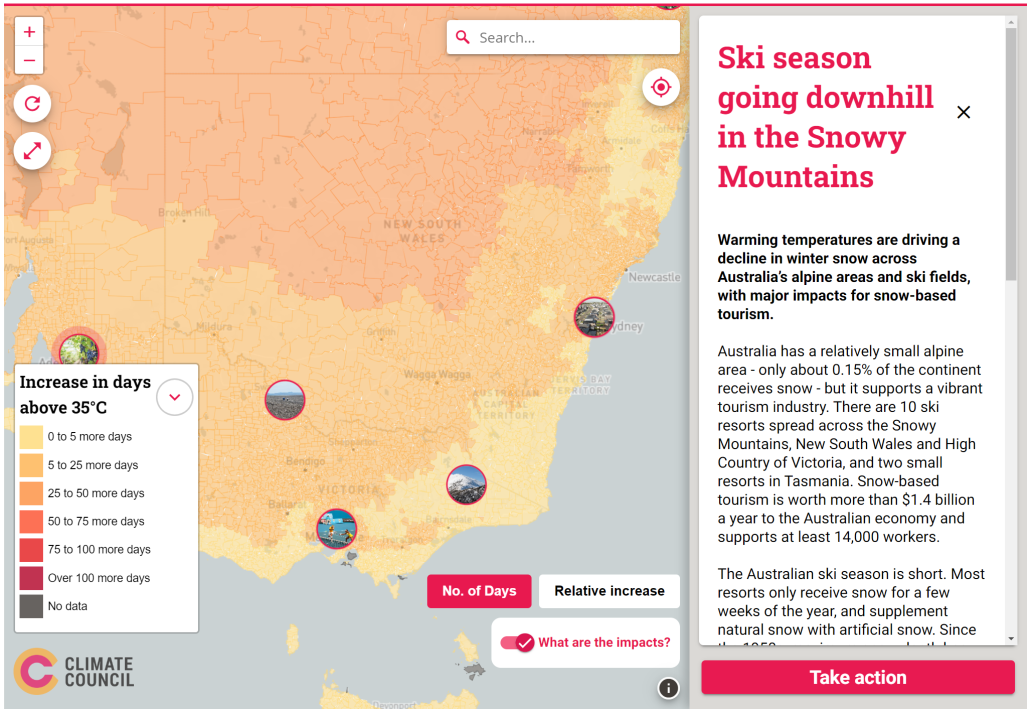
The storytelling objective of the heat map is enhanced by a feature that details various impacts around the country, such as on the food bowl, the Barossa wine region, Great Barrier Reef, the ski season, vital infrastructure and rainforests. The map makes it clear that beyond the inherent health risks, extreme heat has potentially far reaching and dire consequences.
The Climate Heat Map of Australia has already gained solid media attention and, combined with it’s easy usability and shareability, will serve to inform, educate and drive positive action from many thousands of Australians.
You may also be interested in…
How insurable will your home be in the future?
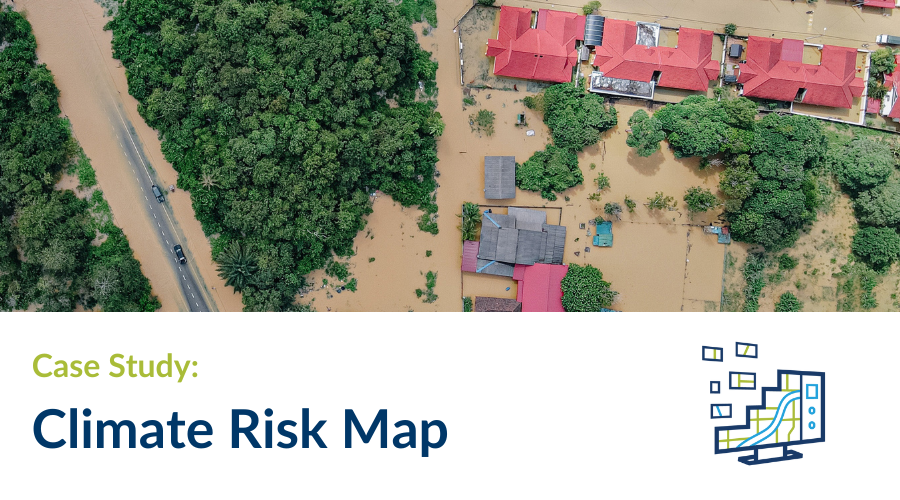
Spatial Vision developed an interactive map of Australia for the Climate Council that represents the vulnerability of any address to the effects extreme weather over different timeframes and emission scenarios.
Climate Risk Map makes its mark
The Community Impact Award at the NSW APSEA Awards has been won by Spatial Vision for the Climate Risk Map delivered for the Climate Council.


