Making the Jacaranda Atlas 9th Edition

In conjunction with John Wiley and Sons, Spatial Vision has recently completed work on the 9th Edition of the Jacaranda Atlas, the pre-eminent student atlas in Australia. This is the third edition Spatial Vision has worked on for John Wiley and Sons, and we continue to improve and expand the content of the atlas with detailed data and new design.
For the 9th edition of the atlas Spatial Vision produced over 300 maps. Some maps were reused with updated data, whilst many were completely new. The subject matter of the student atlas conforms to the Australian Geography Curriculum, and many maps were created with up to date information about Australian and global geographic events.
With the increasing advent of open-source data, sourcing unique datasets for the atlas has been made a lot easier. Spatial Vision sourced data from around the world to incorporate into the atlas maps. Sources include Natural Earth Data for the main atlas plates, and various sources for the thematic maps such as Australian Bureau of Statistics, data.gov.au, the Department of Environment and Energy, and Landsat 8, to name a few.
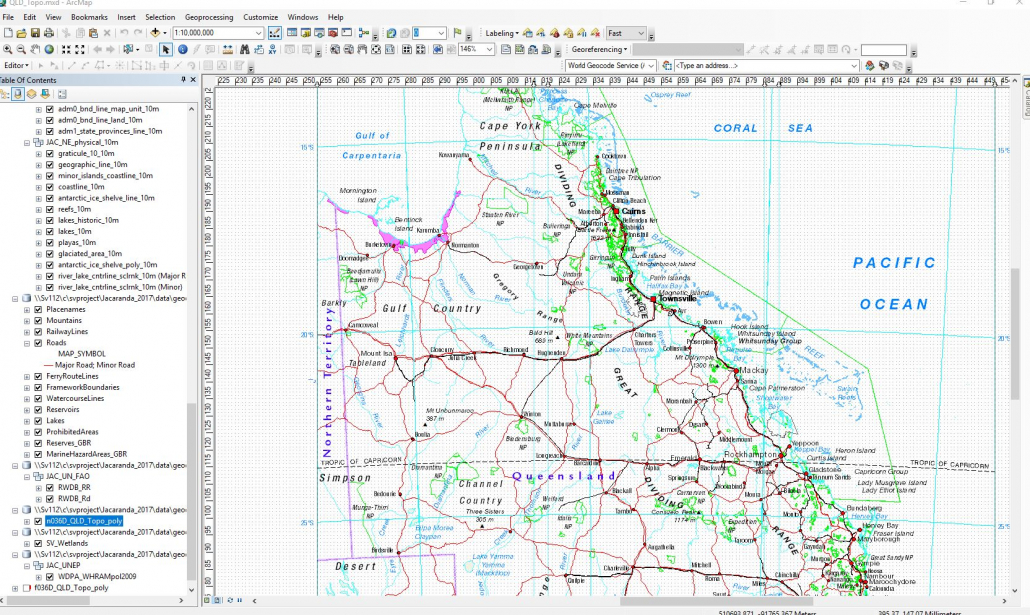
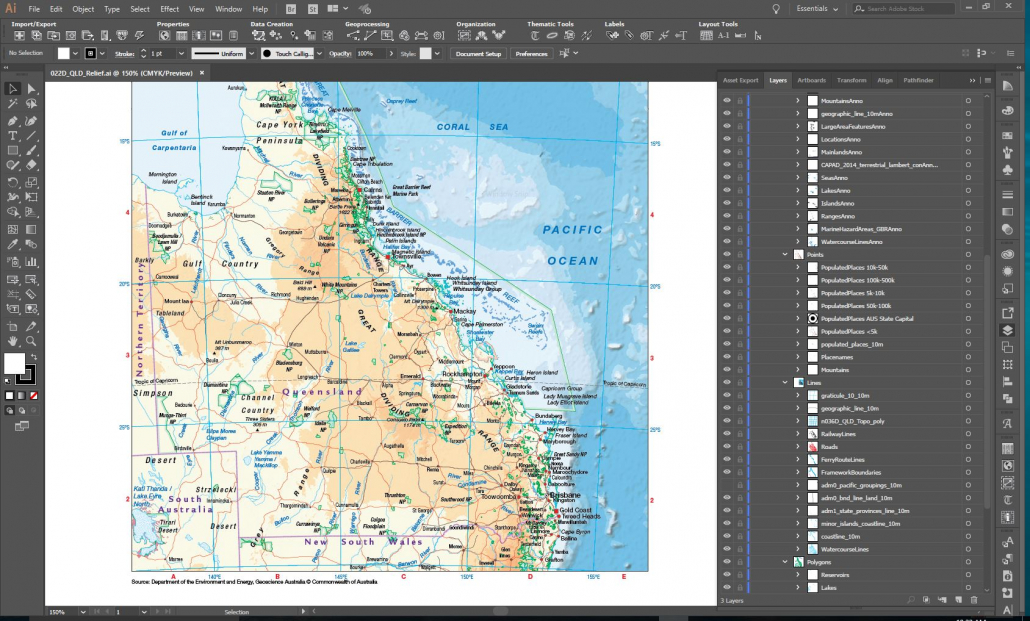
In previous editions of the atlas, the data used for the atlas plates was stored in an Esri geodatabase. For each edition this data has been updated to reflect changes in the world and across Australia. Typically, the main changes are city populations and in some cases minor alterations to country names and boundaries. Each atlas plate has a unique mxd, with annotation carefully positioned. Minor updates were made to annotation placements to accommodate map changes. Final mxd files were exported to Adobe Illustrator (AI) format, with final compilation done to the map in AI, which included positioning relief images, styling lines and pattern polygons. Finished AI files were provided for layout in Adobe InDesign.
Text was extracted and processed from the mxd files for indexing purposes. The processing, checking and editing of the index was probably one of the most difficult aspects of the atlas, ensuring that every feature labelled on the map appeared in the index. Text was extracted for each map, imported into a Microsoft Access database, filtered and collated for final output. Additionally, point features that had been labelled on the map required the latitude and longitude coordinates of the point added to their index reference, plus a colour added to the label indicating if the feature was a land feature, political feature or a hydrographic feature.
The thematic maps were produced solely in Adobe Illustrator using MAPublisher. This was important, as we required spatial referencing for all files, with many maps having their own unique map projection. MAPublisher’s long list of map projections ensured we could choose the most appropriate projection for the map coverage. Additionally, when it was required to add data, we could do this with confidence knowing that MAPublisher supported many different geospatial file formats, and the data would seamlessly align in our map files. This is important for future map updates, as many choropleth maps will require data updates rather than being completely redrawn.
An Illustrator template file was created for all thematic maps that store content for symbology, colour palettes, graphic styles, character styles, MAP Themes, MAP Selections and layer structures. MAPublisher’s MAP Themes tool allowed us to pre-define our styles and queries, so that in many instances data could be imported and styled on the fly, reducing manual effort. Additionally on many maps we used MAPublisher’s LabelPro add-on to assist with labelling the maps, which cut down time in map production.
The production of the 300-plus maps took about 4 months to complete, allowing for corrections and edit cycles. The bulk of the work was completed by three cartographers, with one supervising cartographer.
For more information, please get in touch